Overview #
The Specification Dashboard in DnXT Reviewer provides a comprehensive view of Chemistry, Manufacturing, and Controls (CMC) specification data extracted from your regulatory submissions. It monitors specification health through a composite scoring system, tracks stability trends, evaluates batch performance, identifies impurity risks, and assesses analytical method readiness. This dashboard is an essential tool for CMC reviewers, quality assurance professionals, and regulatory affairs teams who need to maintain oversight of specification compliance across the lifecycle of a pharmaceutical product.
Accessing the Specification Dashboard #
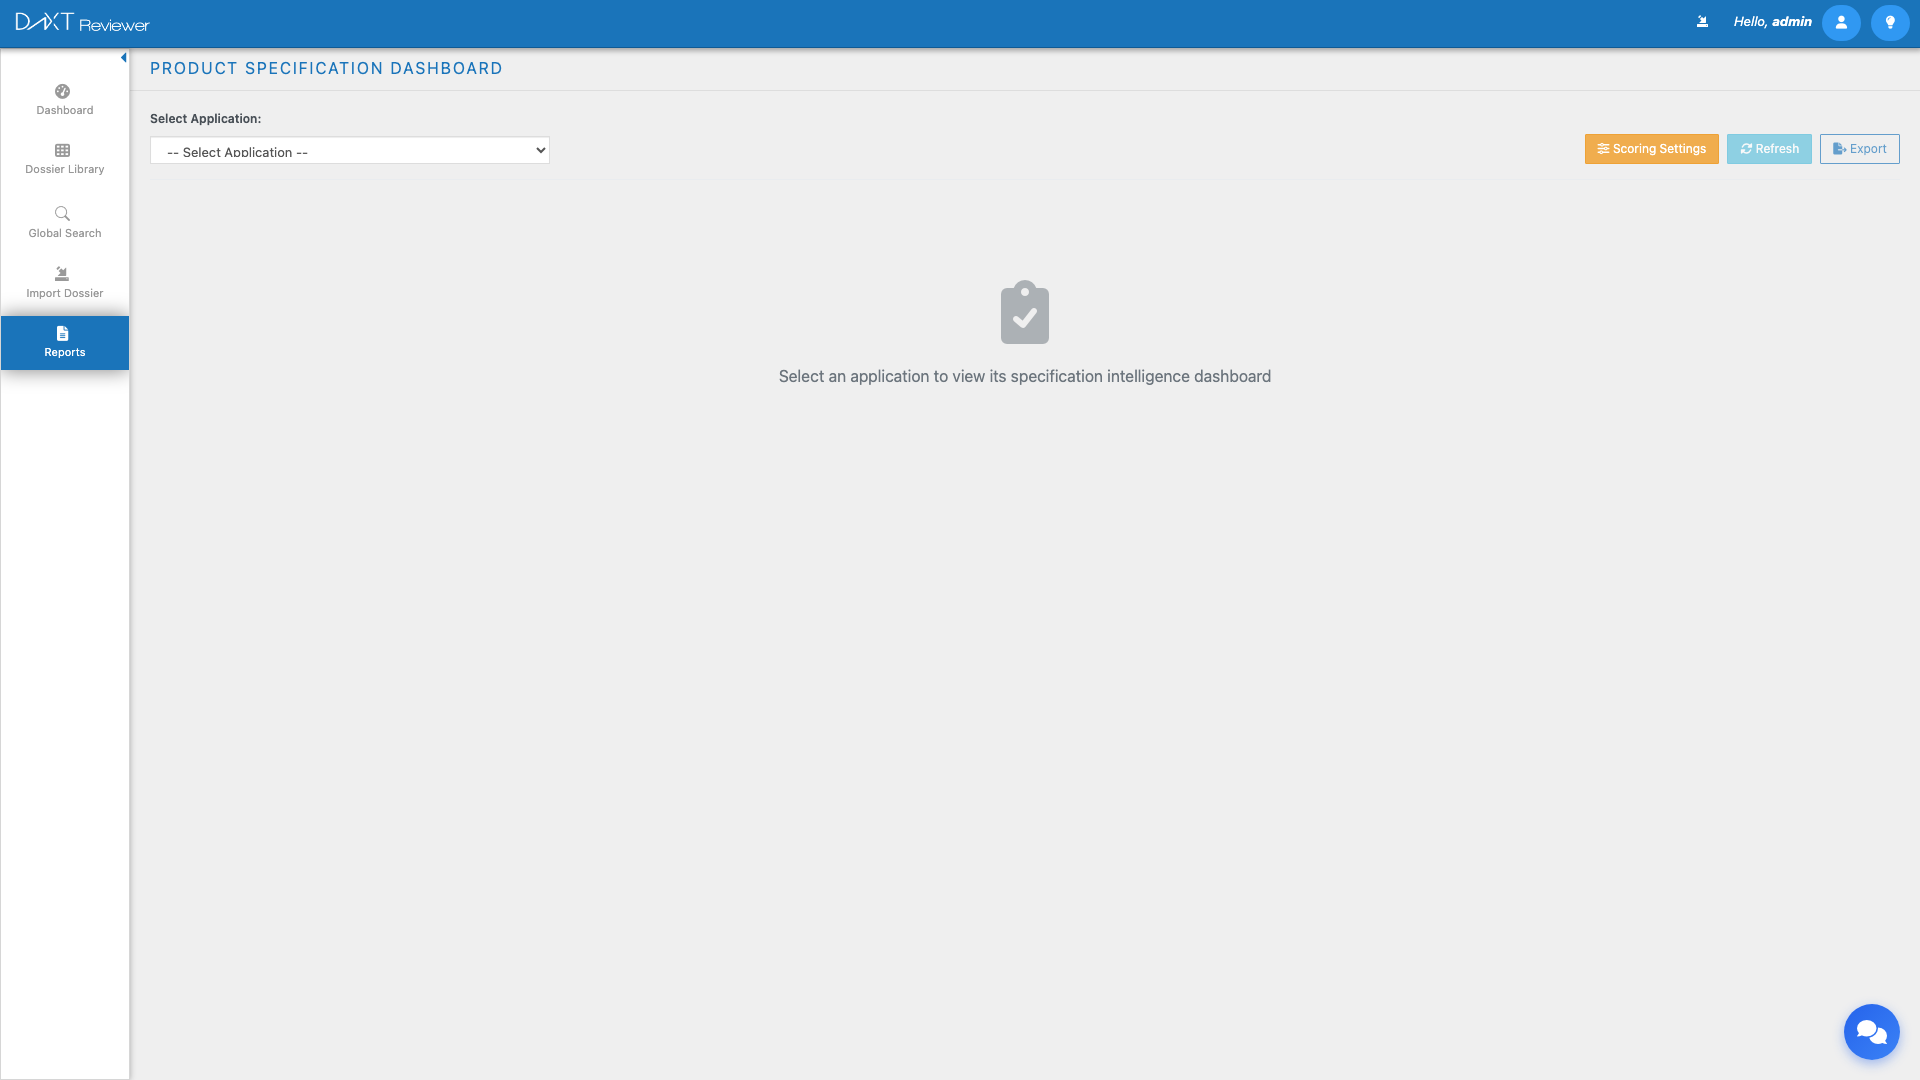
Navigate to Left Sidebar → Reports and click the Specification Dashboard card. The dashboard loads with the application selector and the Specification Matrix tab selected by default.
Dashboard Toolbar #
The toolbar at the top of the Specification Dashboard provides the following controls:
| Control | Description |
|---|---|
| Application Selector | Select which dossier (application) to display specification data for |
| Specification Health Score | Displays the overall health score as a numerical percentage with a color-coded indicator |
| Scoring Settings | Opens a configuration panel to adjust the weights and thresholds used to calculate the health score |
| Refresh | Reloads specification data from the server |
| Export | Downloads the dashboard data as CSV or PDF |
Specification Health Score #
The Specification Health Score is a composite metric that aggregates multiple factors into a single percentage, providing an immediate indication of specification compliance and data quality. The score considers:
- Completeness of specification documentation
- Stability study coverage and trending
- Batch analysis conformance to specifications
- Impurity profile compliance
- Analytical method validation status
Score Ranges #
| Score Range | Color | Interpretation |
|---|---|---|
| 80% – 100% | Green | Specifications are well-documented and compliant |
| 60% – 79% | Yellow | Some areas need attention; review recommended |
| Below 60% | Red | Significant gaps or compliance issues identified |
Customizing Scoring Settings #
Click the Scoring Settings button to open the scoring configuration panel. Here you can adjust:
- Category weights — Increase or decrease the relative importance of each scoring category (stability, batch, impurity, method)
- Threshold values — Set custom thresholds for green/yellow/red score ranges
- Inclusion criteria — Choose which specification types to include in the score calculation
Summary Cards #
Six summary cards provide a high-level overview of the specification landscape:
| Card | Description |
|---|---|
| Specifications | Total number of specification documents identified across all submissions |
| Risk Distribution | Breakdown of specifications by risk level (High, Medium, Low) |
| Stability Studies | Count of stability study data sets found in submissions |
| Batch Analyses | Number of batch analysis records identified |
| Impurities Tracked | Count of distinct impurity species being monitored |
| Methods Validated | Number of analytical methods with validated status |
Alerts Bar #
Below the summary cards, an Alerts Bar displays critical issues that require immediate attention. Alerts are generated automatically based on the specification data analysis and may include:
- Out-of-specification (OOS) batch results
- Stability trending failures or approaching limits
- Expired or about-to-expire method validations
- Impurity levels exceeding qualification thresholds
- Missing specification documents for required tests
Five Analysis Tabs #
The main body of the Specification Dashboard is organized into five tabs, each focusing on a specific aspect of CMC specifications:
Tab 1: Specification Matrix #
The Specification Matrix presents a comprehensive grid of all specification parameters. Rows represent individual tests or parameters, and columns show key attributes such as:
- Test name and method
- Acceptance criteria (limits)
- Current results
- Pass/Fail status
- Source submission and document
The matrix supports filtering by test category, status, and source. Click any row to view the source PDF document directly.
Tab 2: Stability Trending #
The Stability Trending tab visualizes stability study data over time. Key features include:
- Line charts plotting stability parameters (assay, dissolution, degradation products) over time points
- Specification limits overlaid on charts as horizontal reference lines
- Trend extrapolation showing projected values at future time points
- Filter by storage condition (25C/60%RH, 30C/65%RH, 40C/75%RH), batch number, and test parameter
- Data table below the chart showing raw data values
Tab 3: Batch Performance #
The Batch Performance tab analyzes individual batch analysis results. Features include:
- Batch comparison charts showing results across multiple batches for the same parameter
- Doughnut chart showing pass/fail distribution across all batch analyses
- Detailed batch table with all test results, acceptance criteria, and compliance status
- Filter by batch number, test parameter, date range, and compliance status
Tab 4: Impurity Risk #
The Impurity Risk tab monitors impurity levels and tracks them against regulatory thresholds. Features include:
- Impurity tracking table listing each identified impurity with its current level, trend, and threshold
- Risk classification (High, Medium, Low) based on proximity to identification, qualification, and specification limits
- Trend charts showing impurity level changes over time and across batches
- ICH Q3 threshold overlays showing reporting, identification, and qualification thresholds based on daily dose
Tab 5: Method Readiness #
The Method Readiness tab assesses the validation status of analytical methods used in specifications. Features include:
- Method inventory table listing all analytical methods with their validation status
- Readiness score for each method based on validation parameter coverage
- Validation parameter details (accuracy, precision, linearity, specificity, LOD, LOQ, robustness)
- Expiration tracking for method validation studies that have shelf-life requirements
Viewing Source Documents #
Throughout the Specification Dashboard, you can view the original source PDF documents from which specification data was extracted. Click any row’s View Source link to open the PDF in the document viewer. This allows you to verify extracted data against the original submission documents.
Exporting Dashboard Data #
Click the Export button to download the specification dashboard data. The export includes:
- All specification parameters and their current values
- Stability trending data with time-point values
- Batch analysis results
- Impurity levels and risk classifications
- Method validation status
- The overall health score and its component scores
Frequently Asked Questions #
How is specification data extracted from submissions? #
DnXT Reviewer uses AI-powered document analysis to extract structured data from CMC documents (Module 3 content). The extraction identifies tables, specification parameters, test results, and acceptance criteria from PDF documents. The accuracy depends on document quality and formatting consistency.
Can I manually edit extracted specification data? #
The Specification Dashboard currently displays AI-extracted data in a read-only format. If you identify inaccuracies, use the source document reference to verify the correct values. Future releases may include manual data editing capabilities.
What does the Health Score consider? #
The Health Score is a weighted average of five sub-scores: specification completeness, stability trending compliance, batch pass rates, impurity risk levels, and method validation coverage. The weights for each sub-score can be customized via the Scoring Settings panel.
Can I compare specification data across different applications? #
The current dashboard displays data for one application at a time. To compare across applications, export data from each application and compare the exported files, or switch between applications using the Application Selector.
How often should I run AI enrichment for specification data? #
Run AI enrichment after importing new submission sequences that contain CMC data (Module 3 documents). There is no need to re-run enrichment unless new data has been imported or you want to use updated AI models.
Related Articles #
- Reports Overview — All available report types
- Chronology Report — Submission timeline and history
- Labeling History Report — Document version tracking
- Correspondence Tracking — Agency communication management